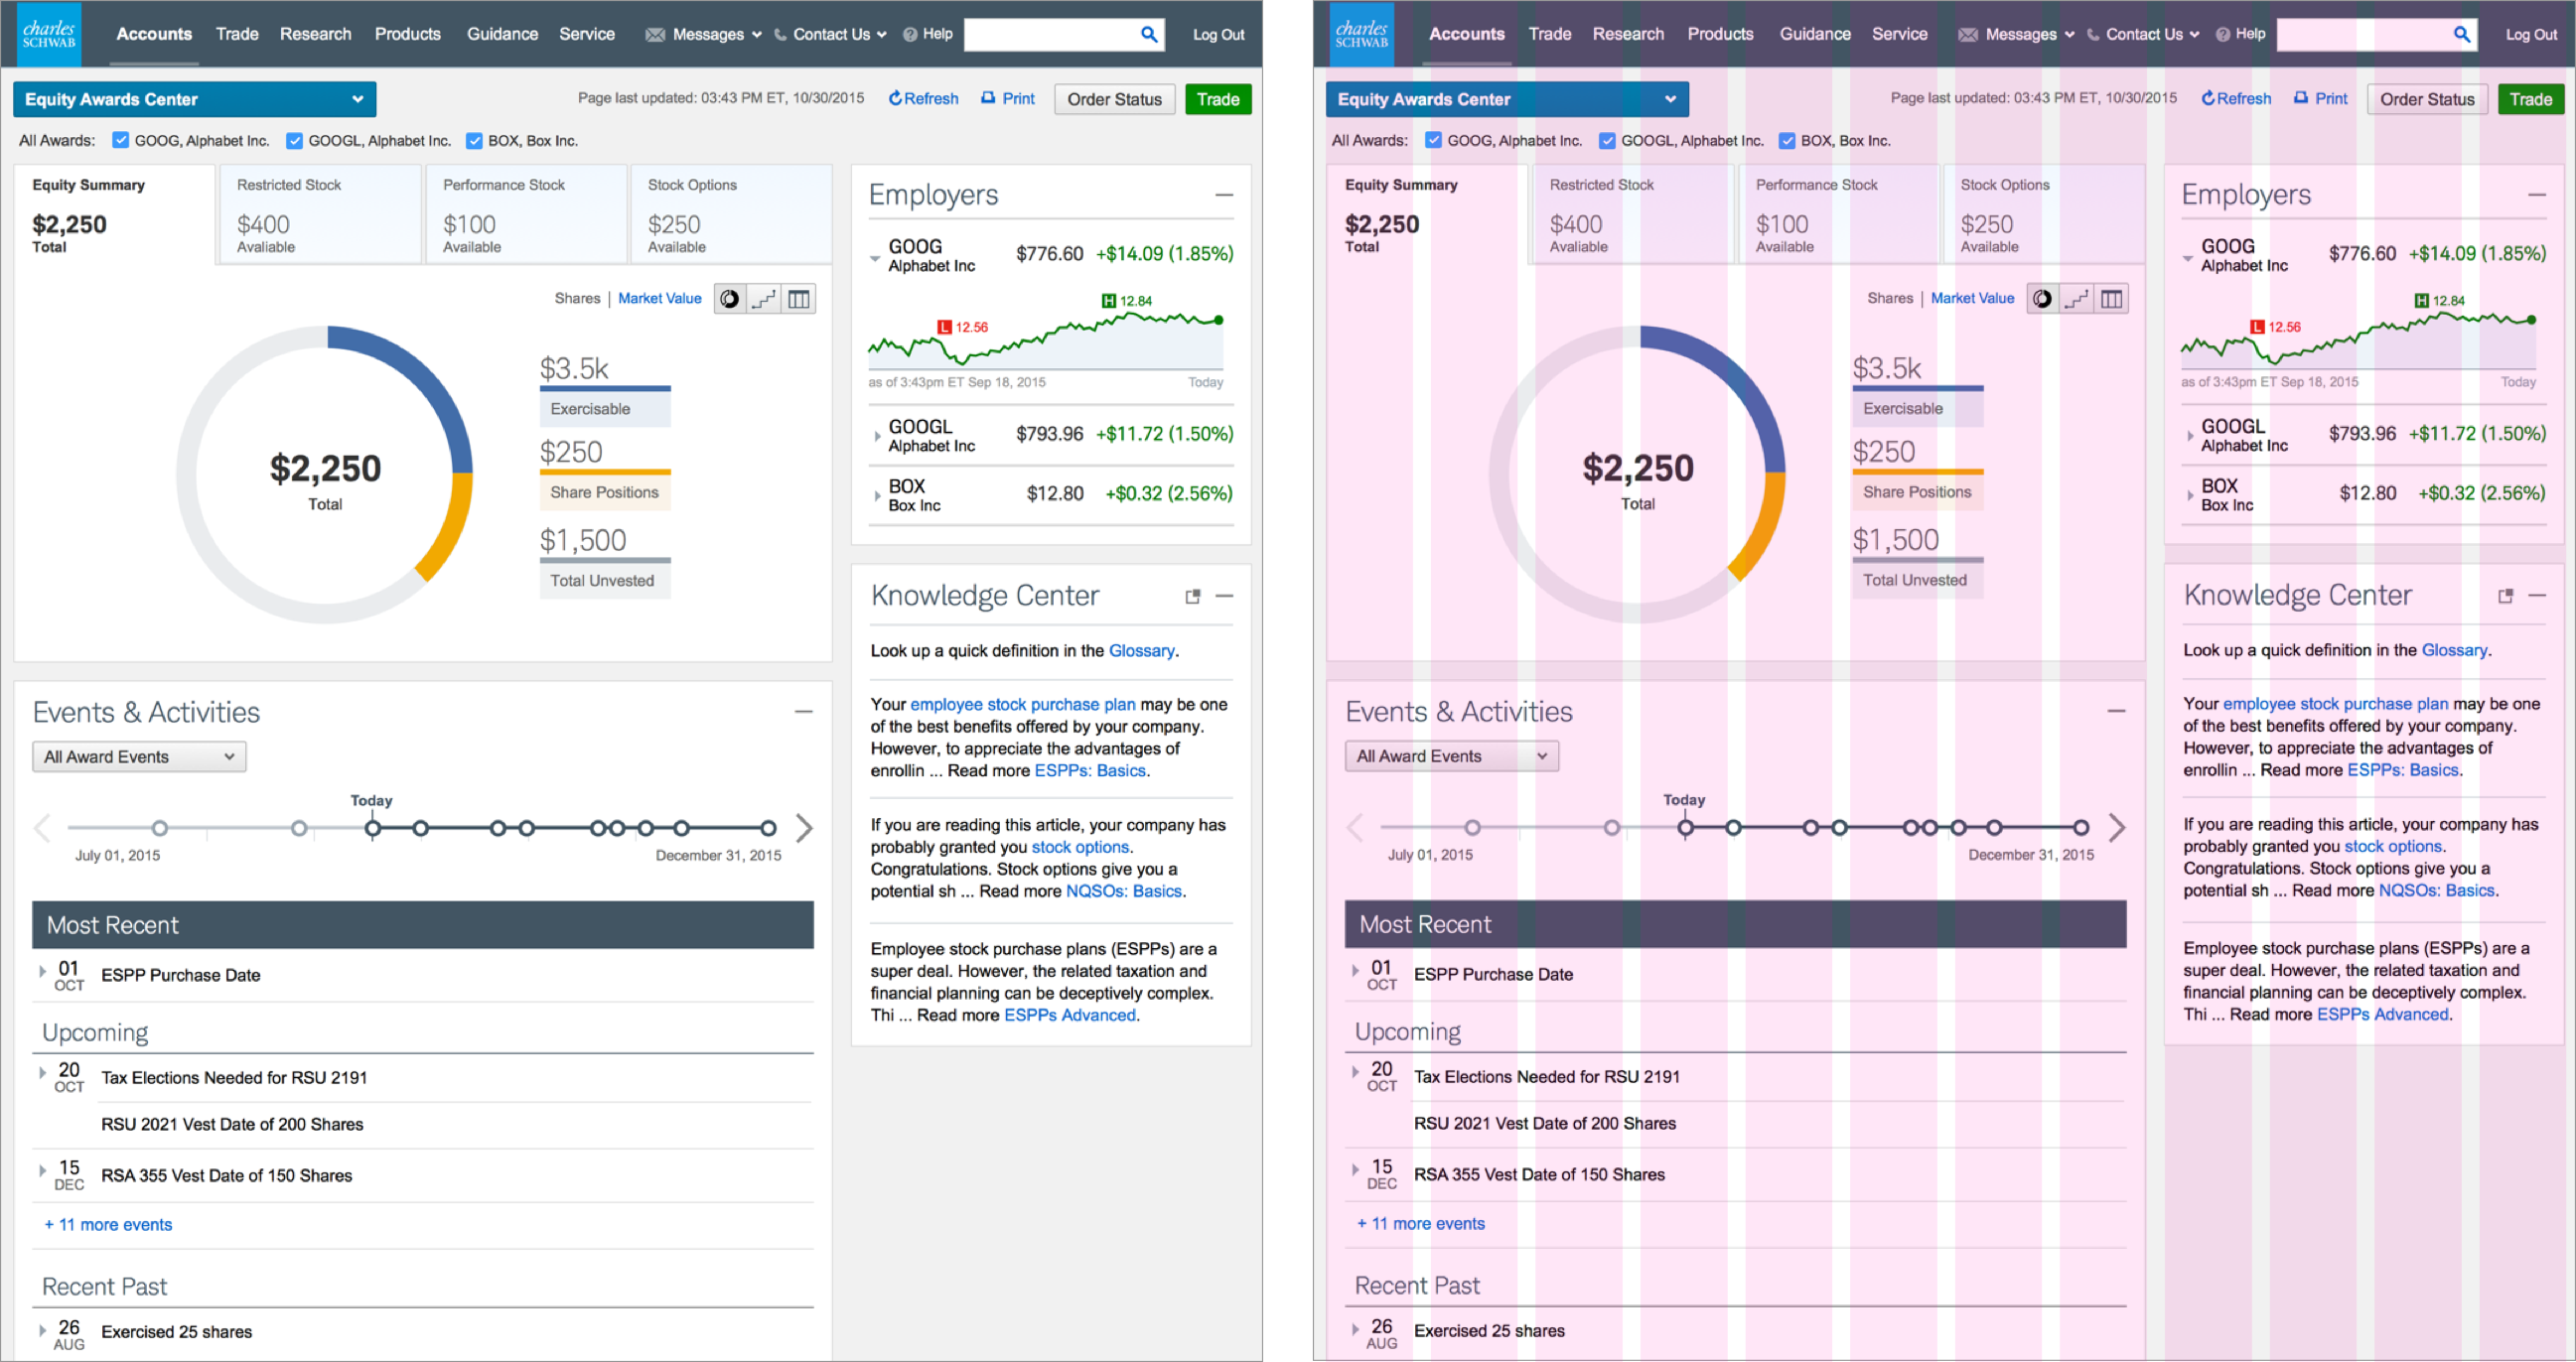
The Dashboard
When a user logs in to the EAC, this page provides an at-a-glance summary of exercisable and unvested stocks.
Lead UX/UI Designer
In the technology industry, companies commonly offer stock options as part of compensation packages. Schwab offers a service to manage the individual accounts for the company. This is the product which the employees themselves will interact with to manage their vesting accounts.
When a user logs in to the EAC, this page provides an at-a-glance summary of exercisable and unvested stocks.
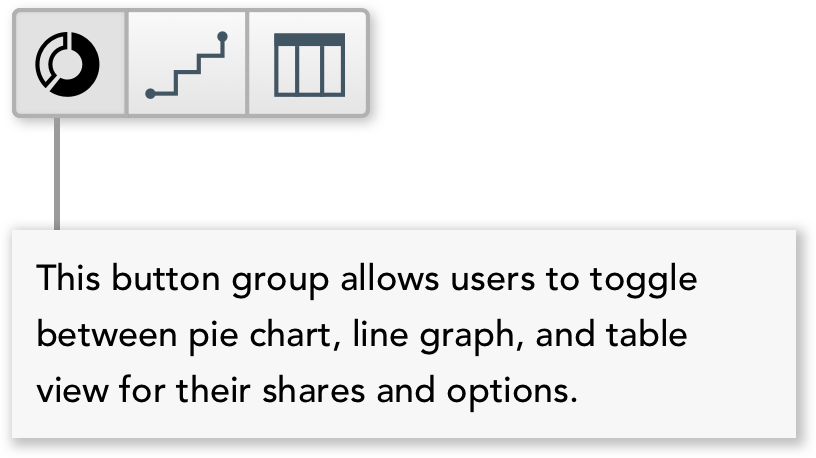
I designed this custom UI element to be compact but effective at communicating the view options.
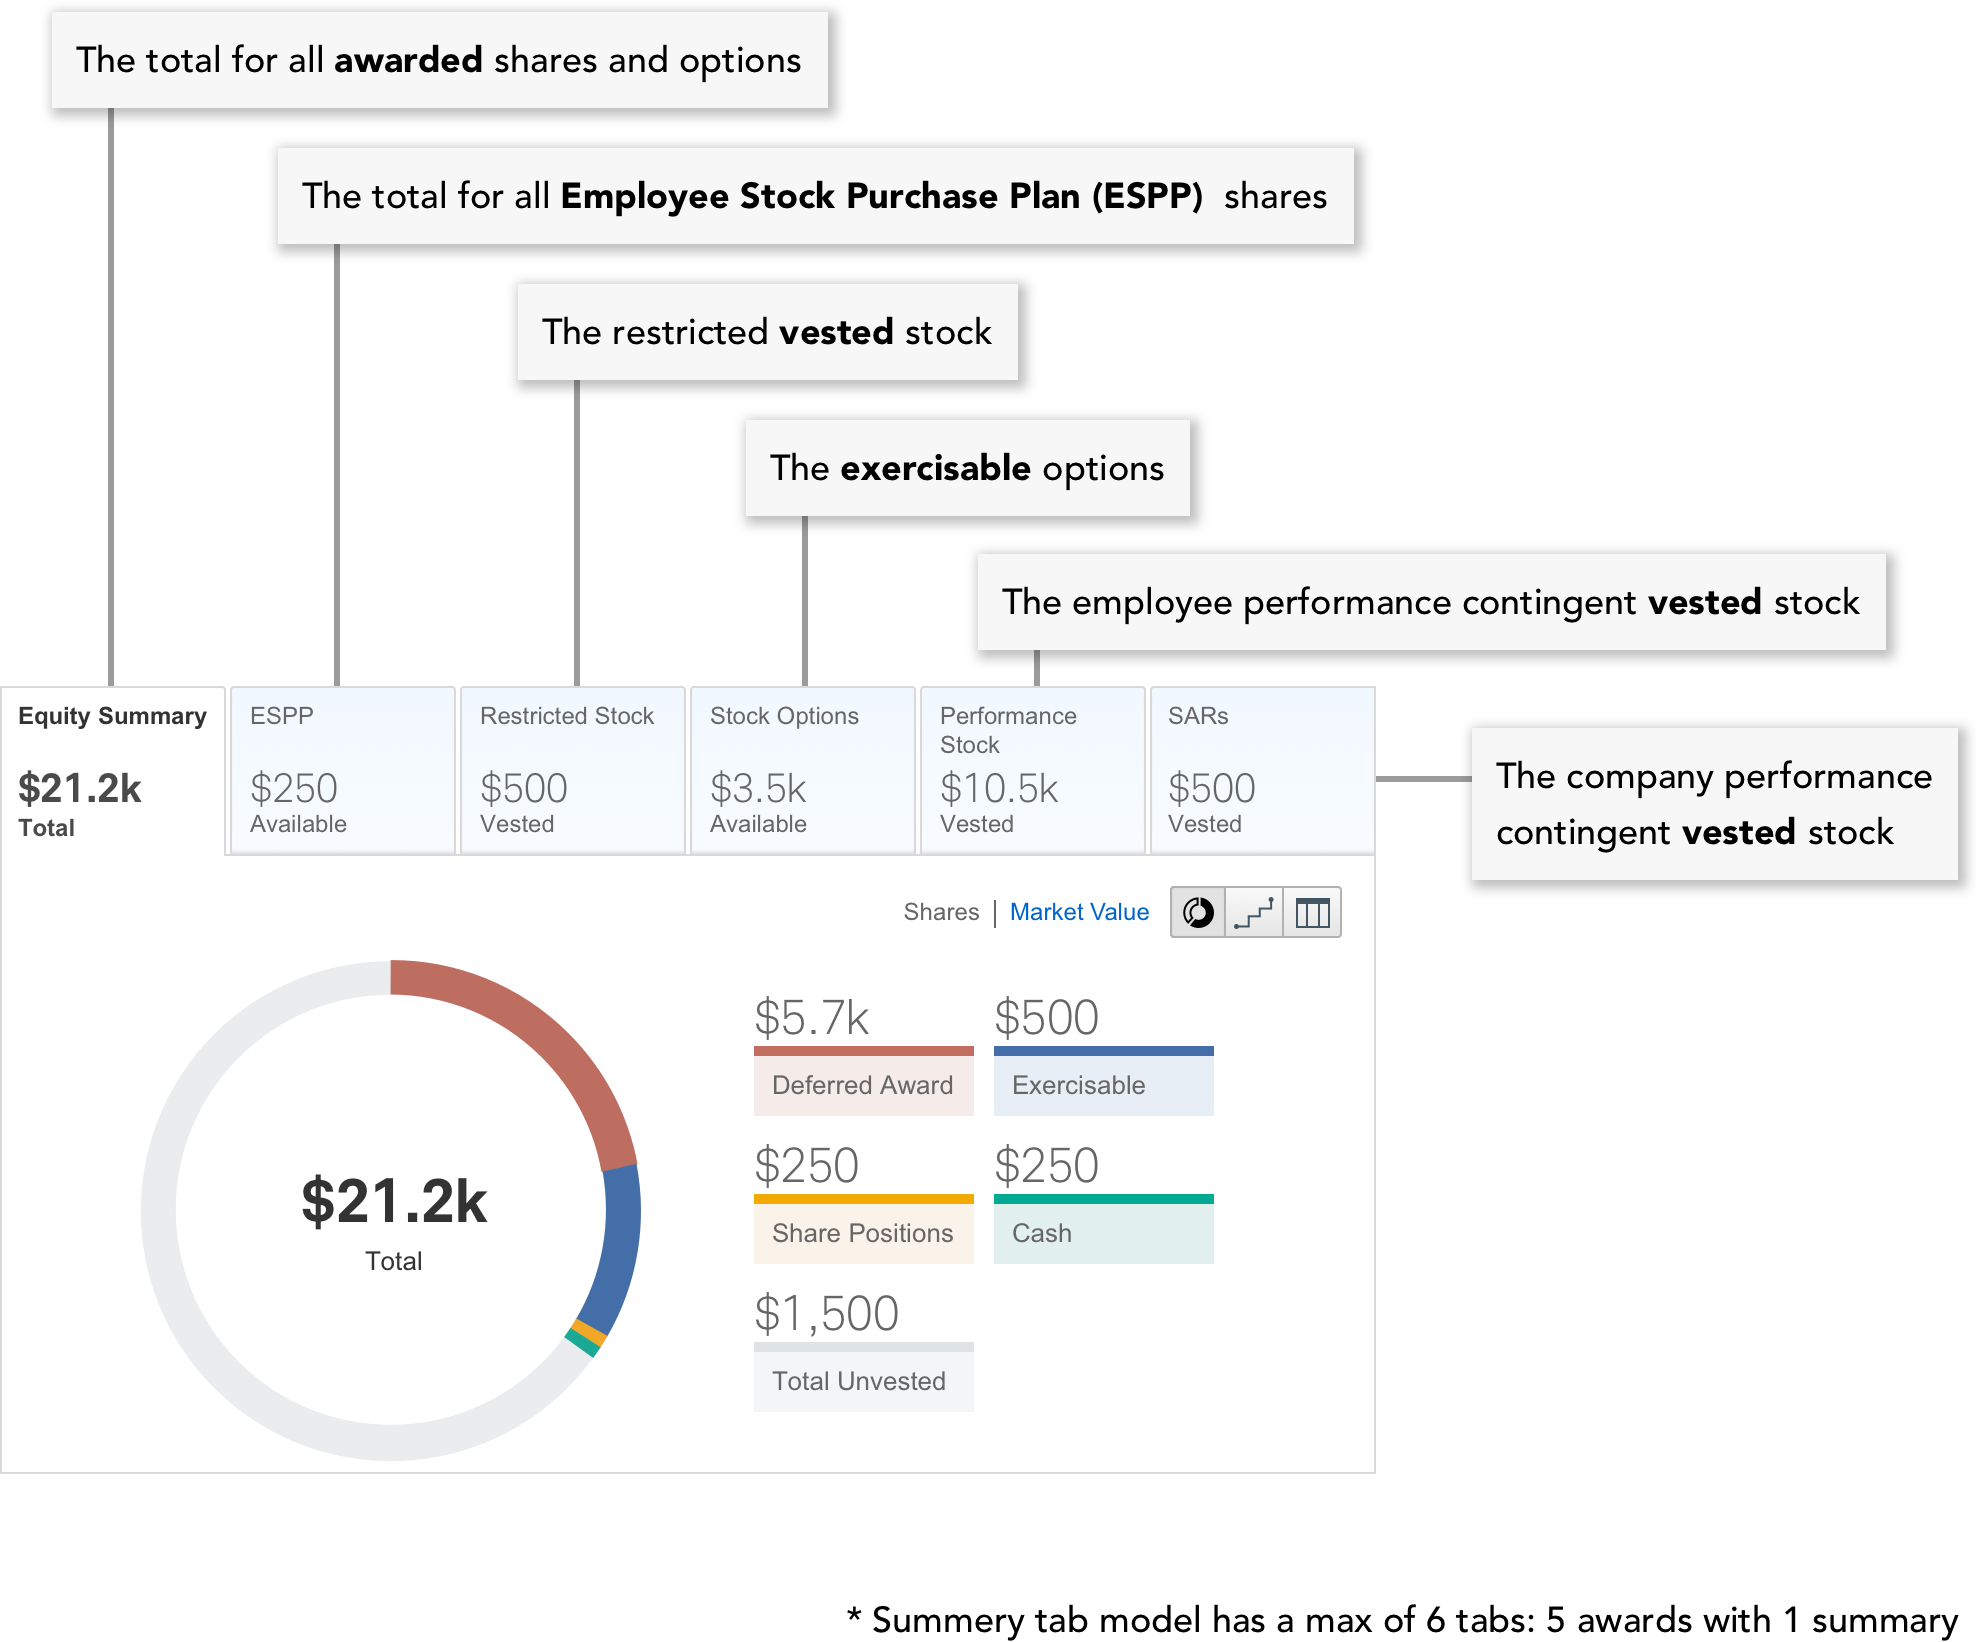
I spoke with experts from Charles Schwab and studied their online resources to learn about award types and how I could accurately represent them. The tabs differentiate between award types, with the summary chart below representing the currently available shares and options and the future equity payments that are scheduled.
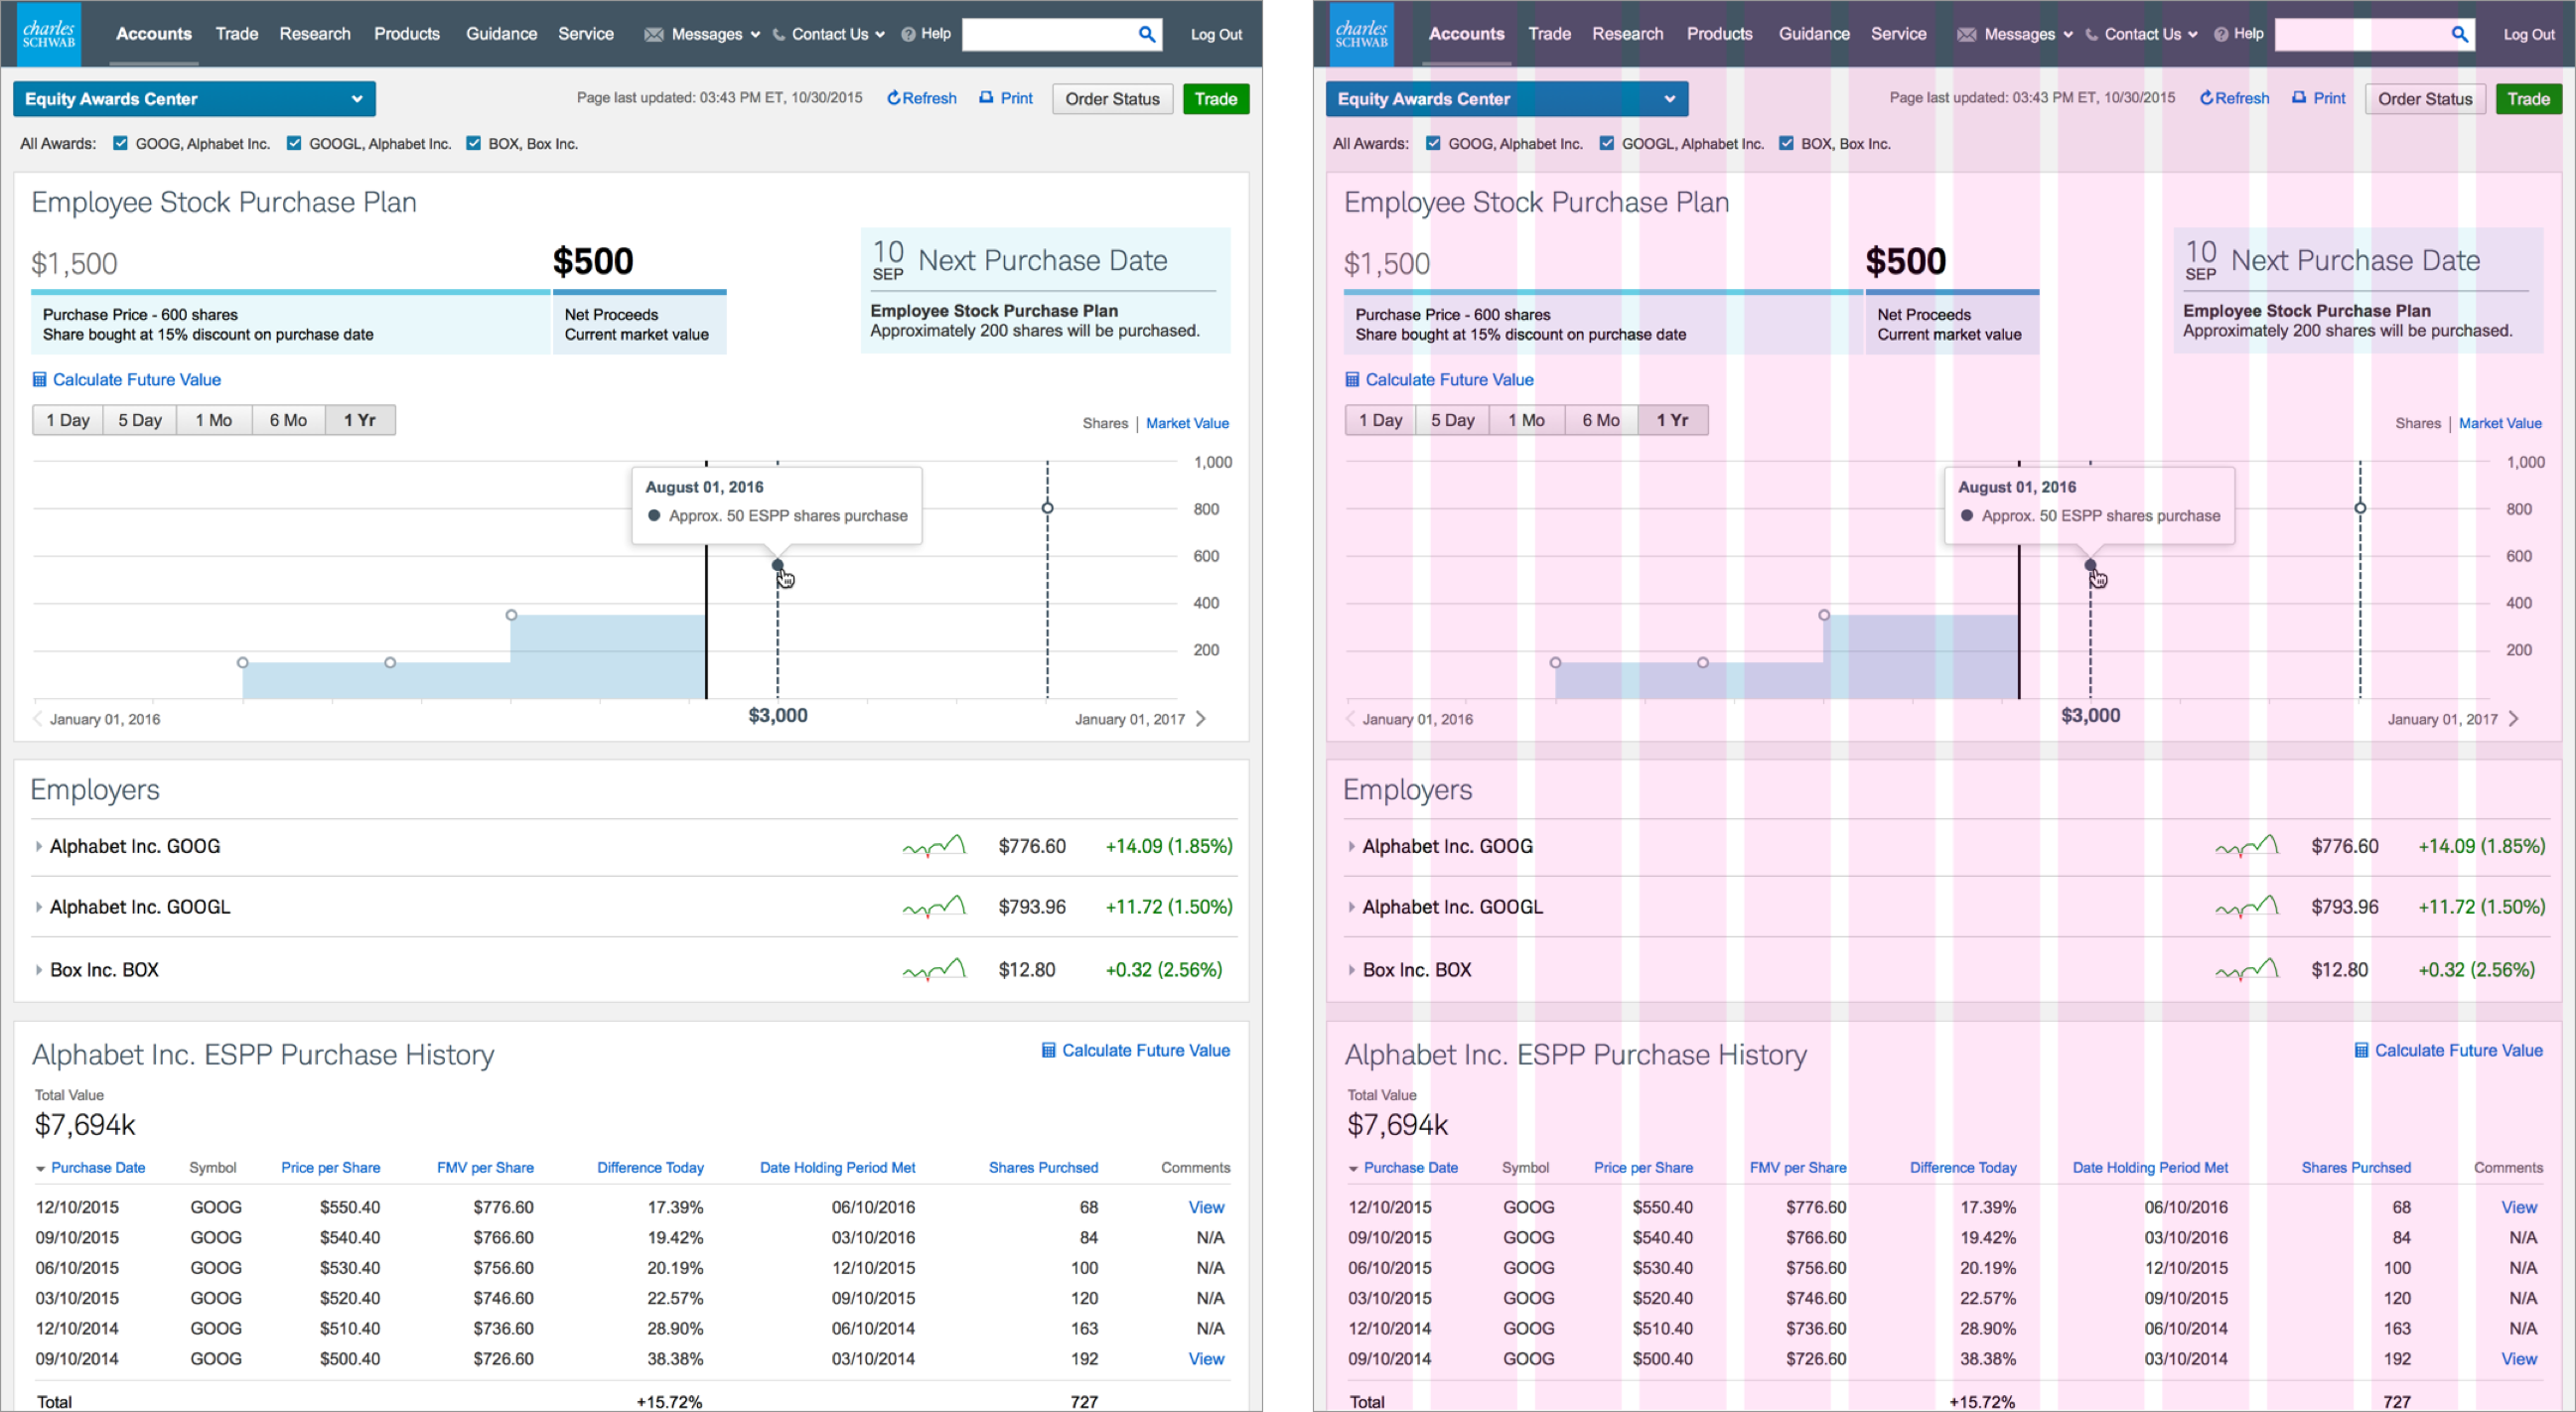
The hover effect on the charts reveals more detailed information. By hovering over a section of the pie chart, the user can see a breakdown of what shares or options are included in the category.
Hovering over the line chart shows the user a forecast for future vesting awards.
This section displays all vesting dates, purchase days, trading windows, and other account related deadlines. Initially a traditional grid layout was considered to visualize the dates, but was determined to be ineffective as the events are often more than 30 days apart. This timeline approach gives the user has a concise and interactive view of account relavant events.
Here, a user can find more details about their award. The graph shows past, current, and predicicted value of their shares and options.
This video, created by Charles Schwab, explains the product and features of my design.